Viewing dbt™ Project Run Details
You can view the details of your dbt project run from the Execution History page in the dbt Projects Detailed View. If you want to view the entire activity of the dbt project, click Activity Log in the Tools bar. Read Activity Log for the details displayed on this page.
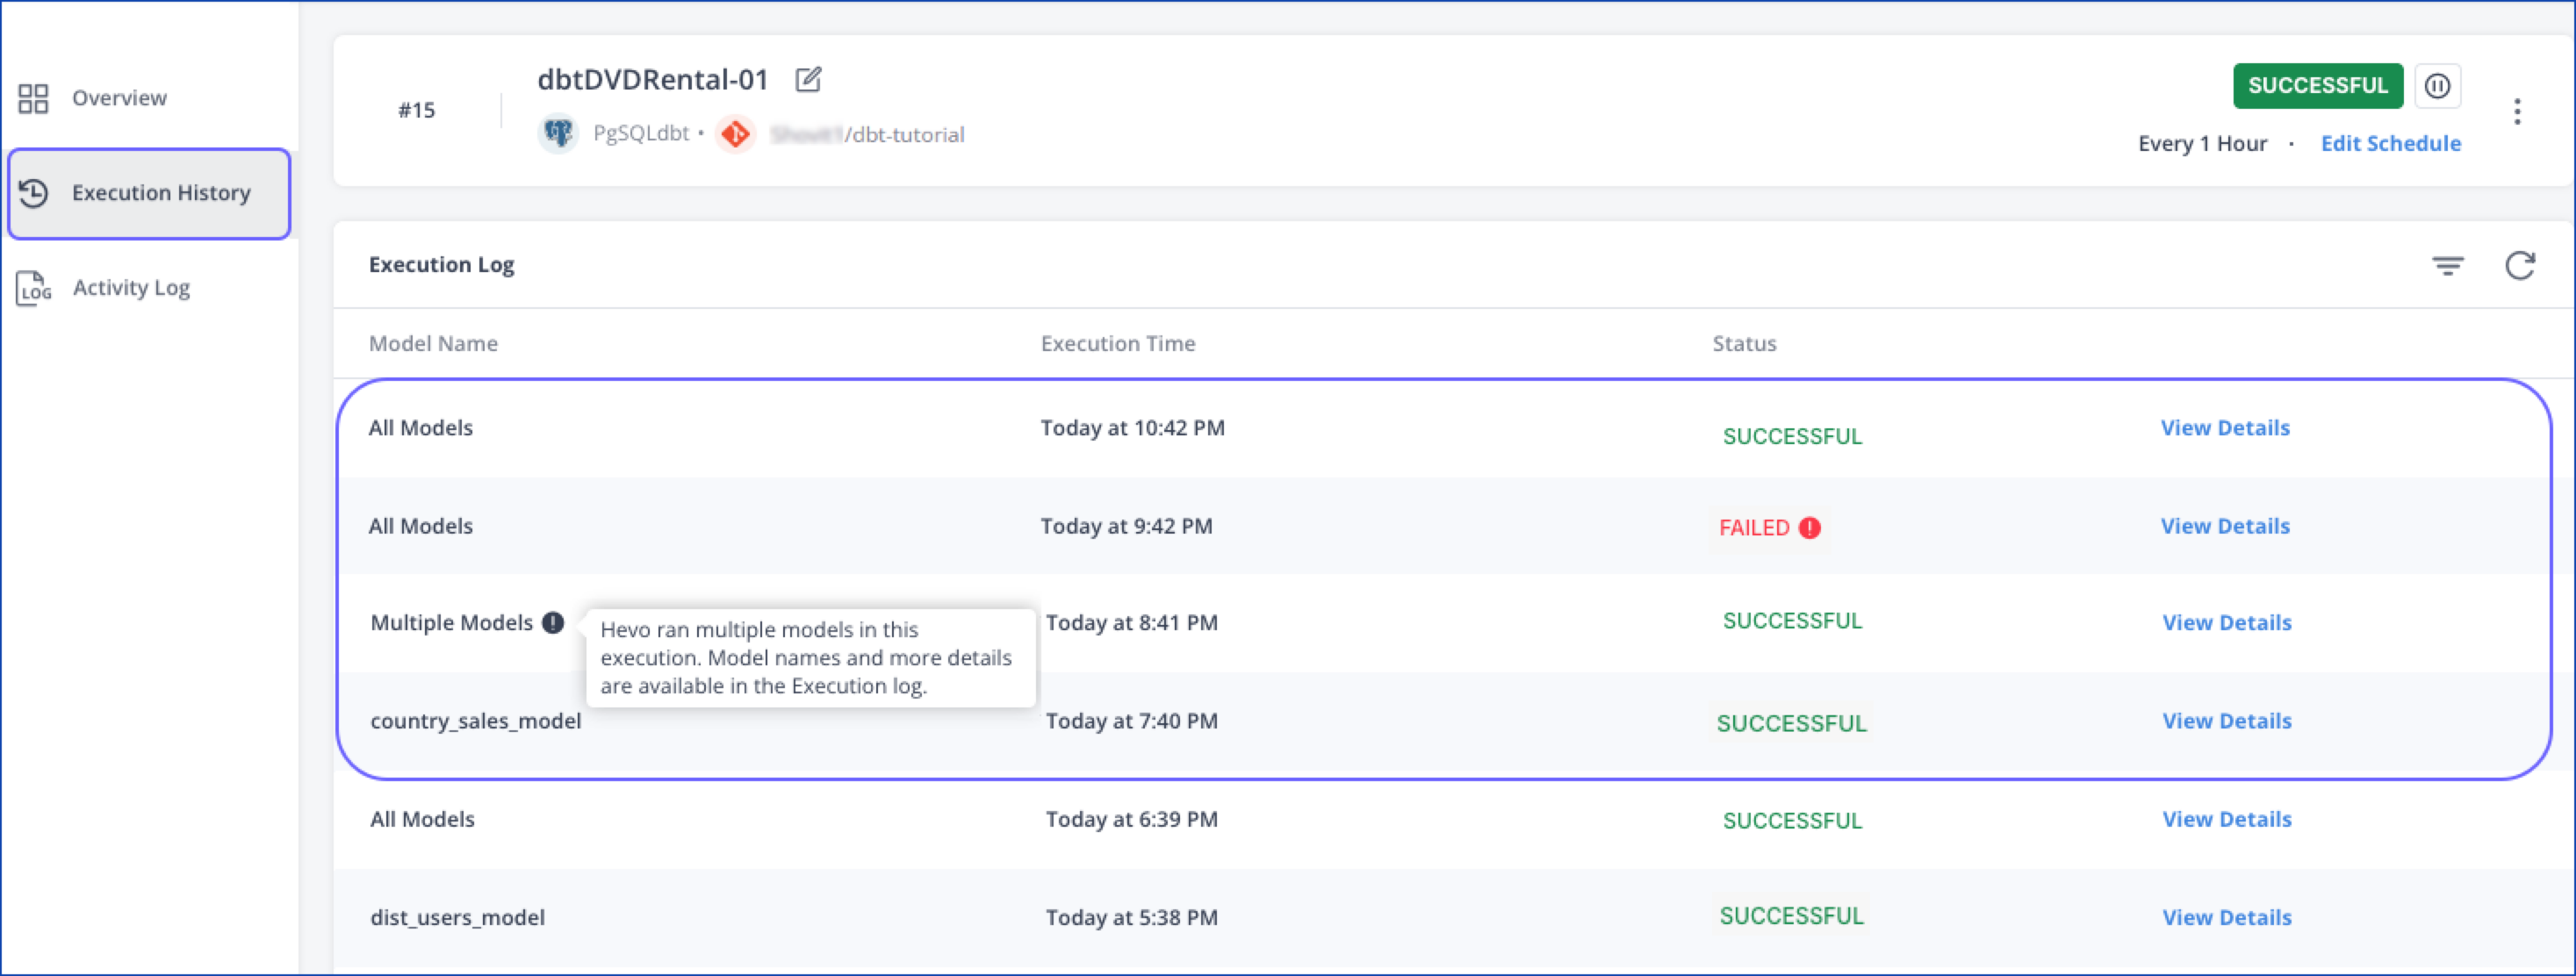
The Execution Log section on the Execution History page displays the details of each run in reverse chronological order, with the latest run details displayed at the top.
Each row in this section displays the following details for a run:

-
Model Name: Displays the models executed in the project run. For a schedule created at the project level, this value is All Models. For a schedule created at the model level, this value is Multiple Models, and if an individual model is executed with the Run Now option, the name of the model is displayed. For example, in the image above, country_sales_model is executed with the Run Now option.
-
Execution Time: The local time at which the project ran.
-
Status: The status of the run. This can be SUCCESSFUL, FAILED, or RUNNING. You can filter the details of the runs based on the status.
-
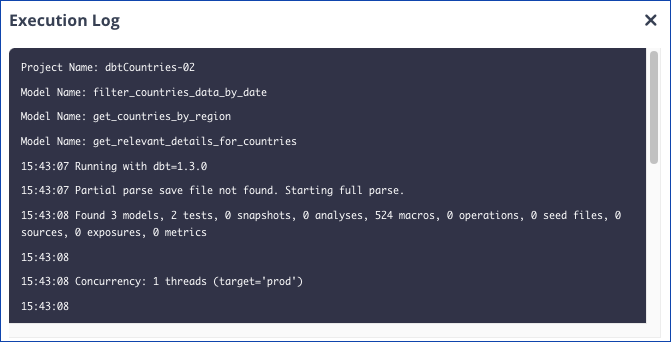
View Details: View the log of all the actions performed by Hevo during a project run. To view the execution log, click View Details in that row.

The Execution Log pop-up displays the detailed list of actions that occur in a dbt project run. For example, the project name, the list of all models executed in the run, the creation of the target tables and views, and the status of the run.
