Monitoring and Managing Runs (Edge)
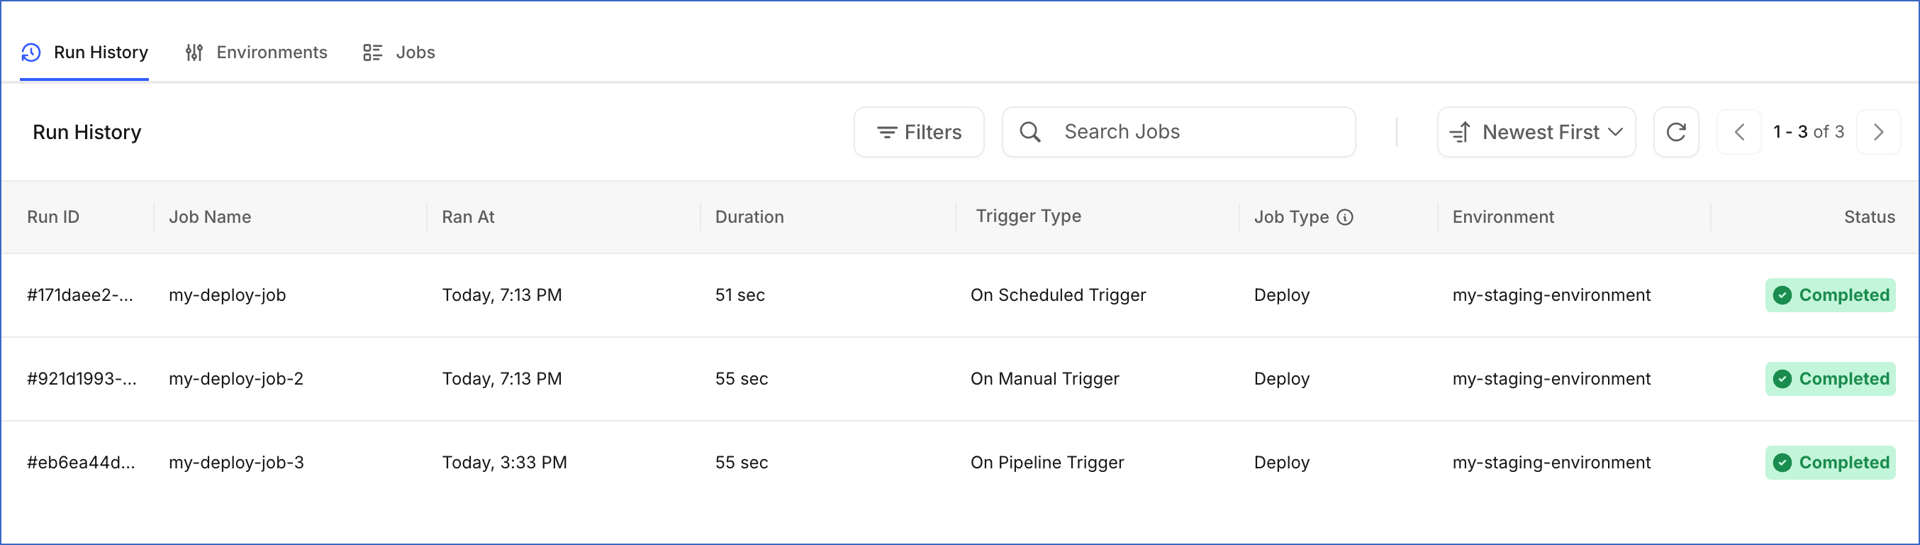
A run is a single execution of a job. Each time a job executes, Hevo records the run details in the Run History tab. You can use the run history to track run statuses such as whether a run completed, failed, or was canceled, and the trigger type that initiated it.
Run Statuses
The run status indicates the progress or outcome of a run. The following table describes the possible run statuses:
| Status | Description |
|---|---|
| Queued | The run is waiting to be picked up for execution. |
| Running | The run is currently in progress. |
| Completed | The run has finished successfully. |
| Failed | The run encountered an error and did not complete. |
| Canceled | The run was stopped before it could complete. Destination data may be in a partially updated state until the next successful run. |
| Skipped | The run was skipped because another run of the same job was already in progress. |
Trigger Types
The trigger type indicates how the run was initiated. The following table describes the possible trigger types:
| Trigger Type | Description |
|---|---|
| On Scheduled Trigger | Triggered automatically based on a schedule configured for the job. |
| On Manual Trigger | Triggered manually using the Run Now option through the Jobs tab. |
| On PR Trigger | Triggered automatically when a pull request is opened or updated against the target Git branch. |
| On Merge Trigger | Triggered automatically when changes are merged into the target Git branch. |
| On Pipeline Trigger | Triggered automatically when a connected Pipeline finishes syncing. |
| On API Trigger | Triggered through an external API call. |
| On Re-run Trigger | Triggered by clicking Re-run on a completed or failed run to execute the same job again. |
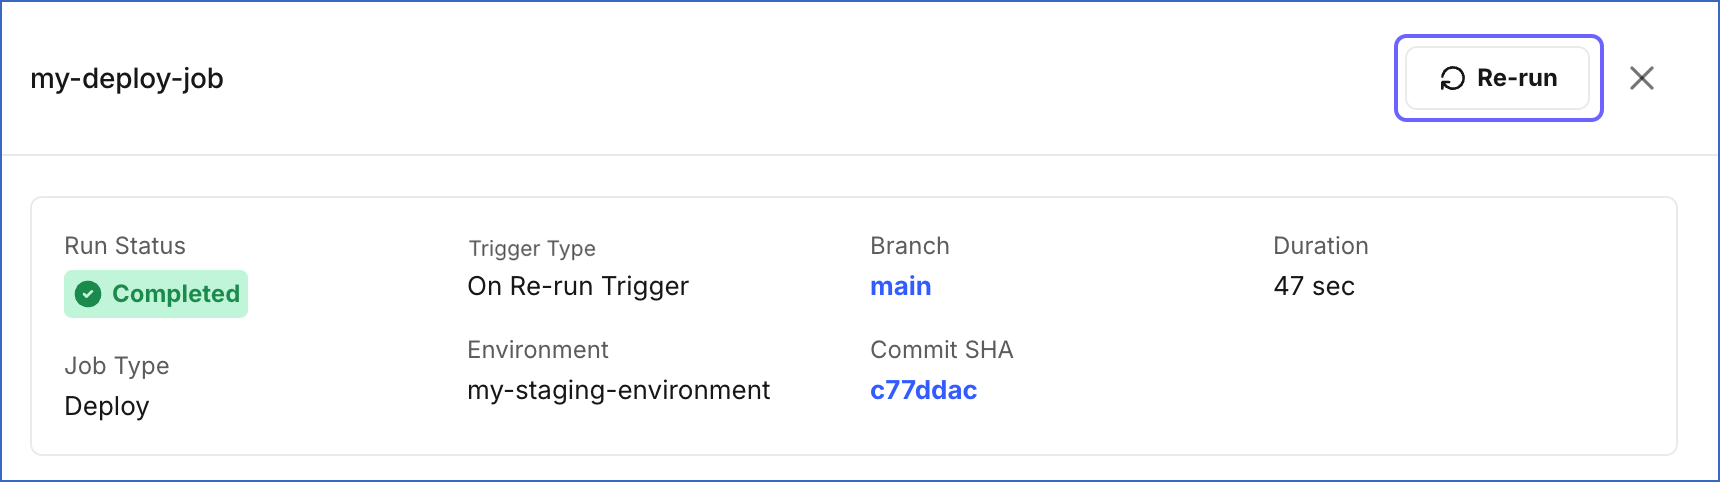
Viewing Run Details
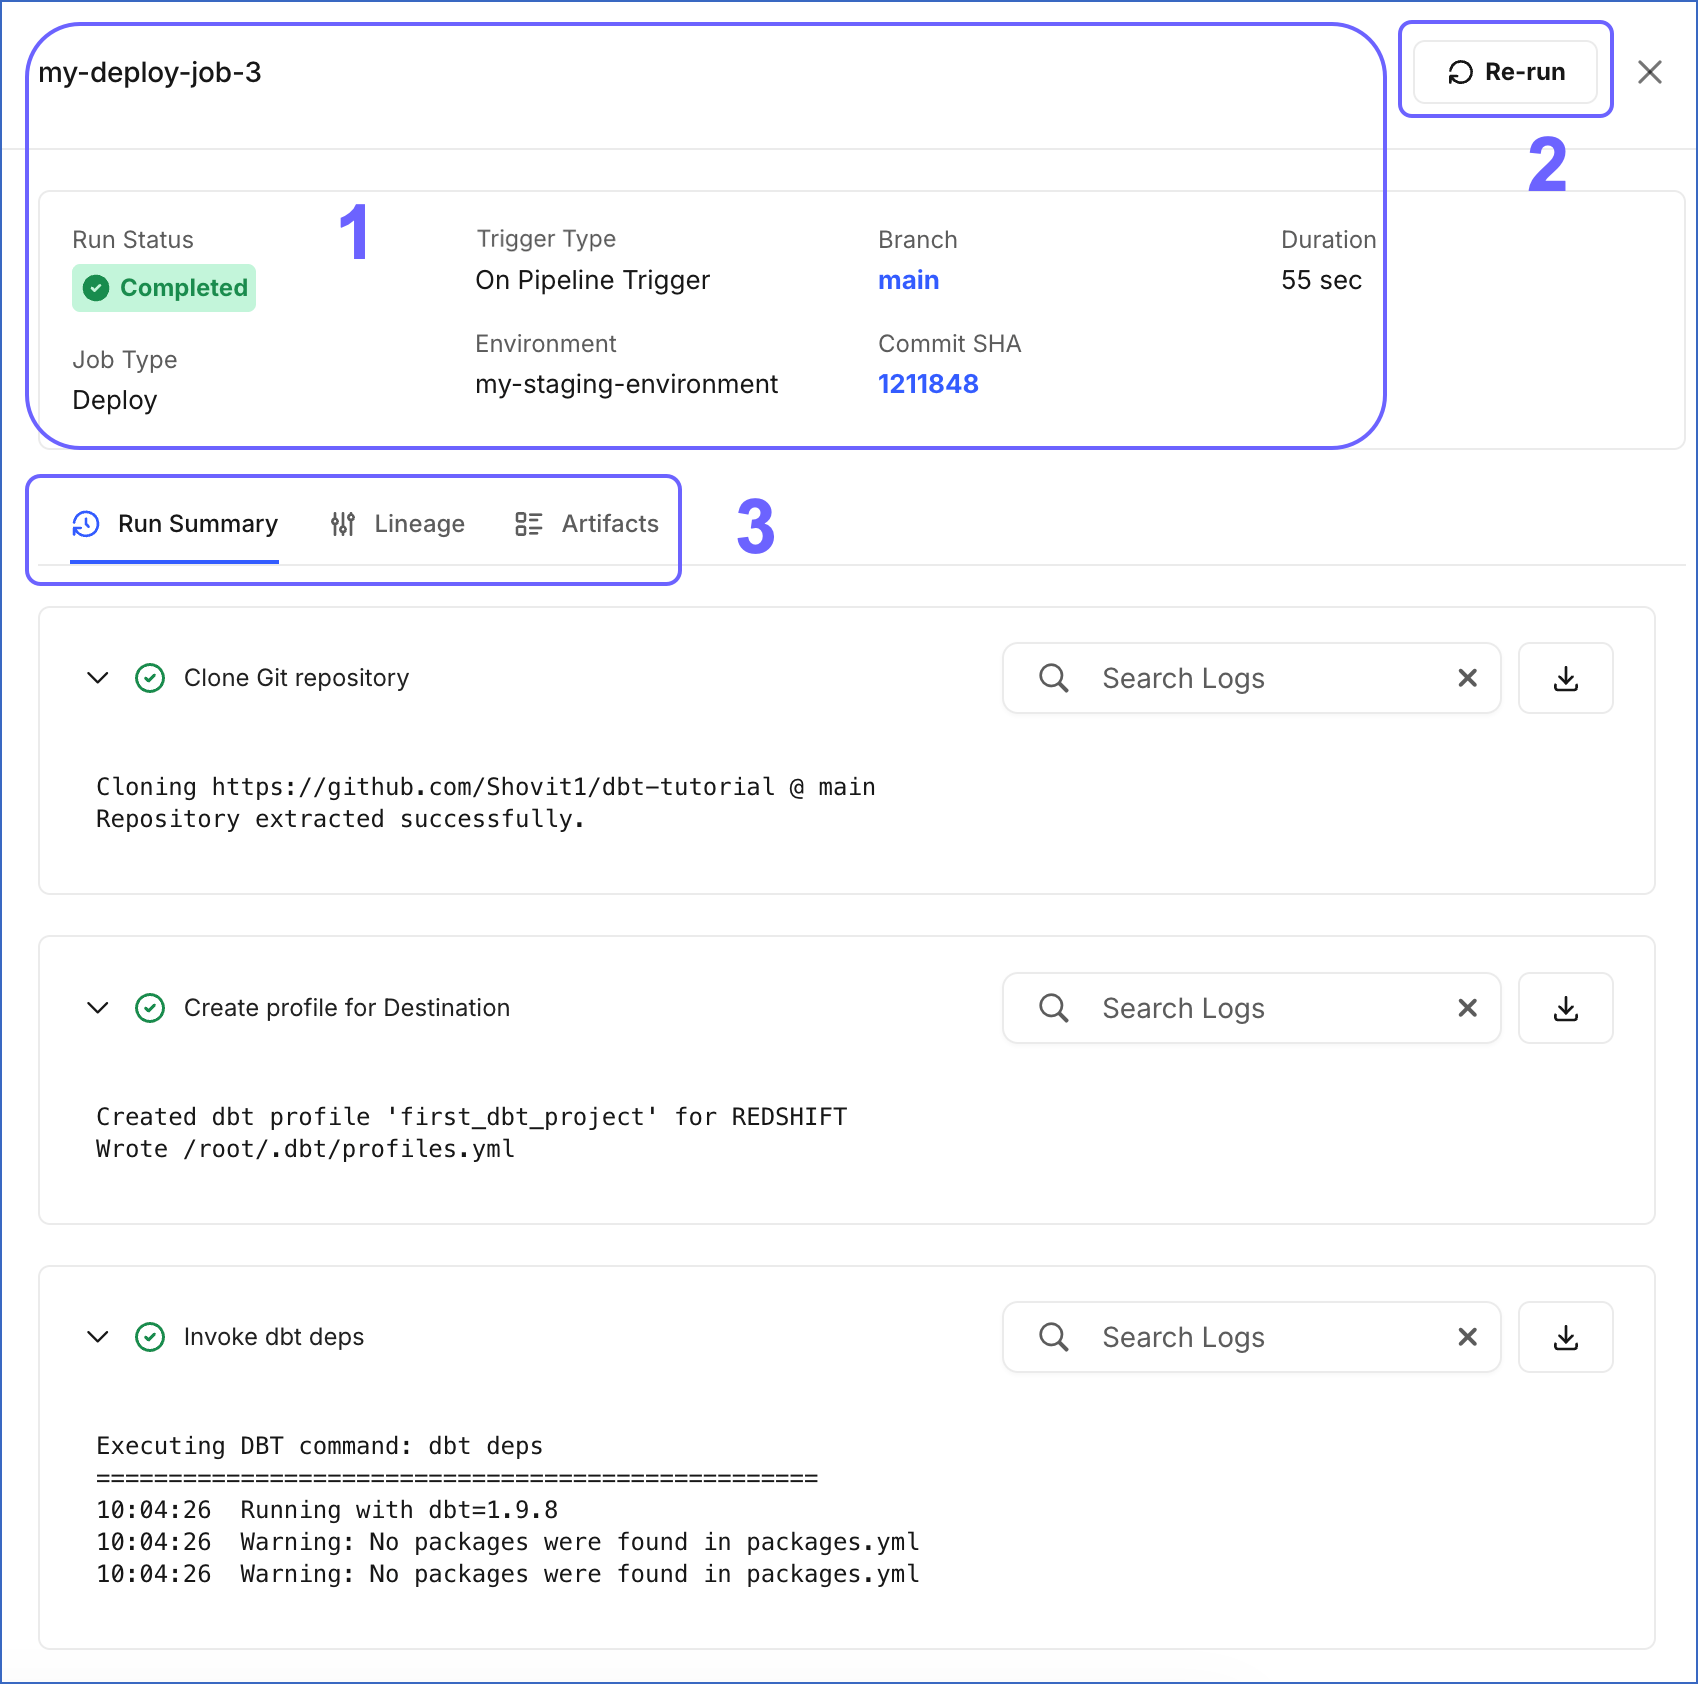
The Run History tab opens by default when you open a Transformation project in the Detailed View. Click anywhere in a run summary row to open its detailed view in a slide-in page. It displays the execution details and logs for that specific run. The following image highlights the main components of the page:
The following table describes each of these components:
| Page Component | Title | Description |
|---|---|---|
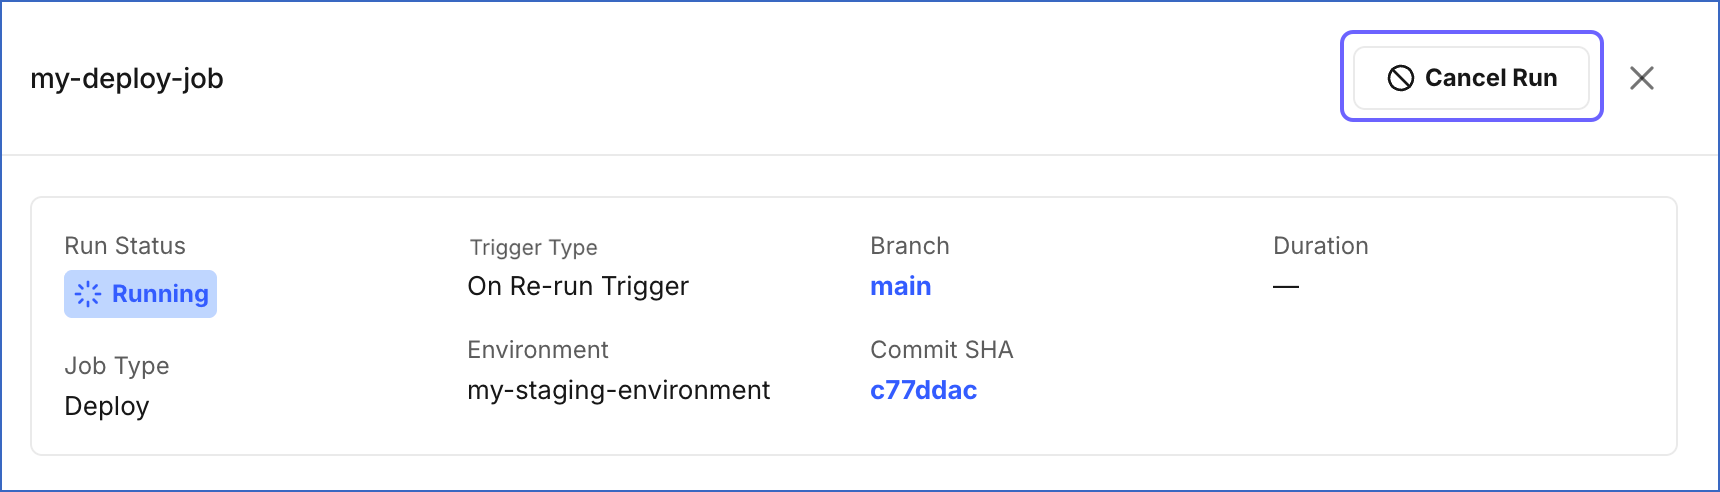
| 1 | Run Details | Displays the name of the job and a summary of the run. This includes: - Run Status: The current status of the run. - Trigger Type: The mode used to trigger the run. - Branch: The Git branch on which the run executed. Click to view the branch on GitHub. - Duration: The total time taken to complete the run. - Job Type: The type of the job, either Deploy, Continuous Integration (CI), or Merge. - Environment: The environment in which the run executed. - Commit SHA: The specific Git commit on which the run was based. Click to view the commit on GitHub. |
| 2 | Run Actions | Displays the action button available for the run based on its current status: - Re-run: Appears when the run status is Completed or Failed. Click to trigger a new run of the same job. Read Triggering a Re-run for detailed steps. - Cancel Run: Appears when the run status is Running. Click to stop the run. Read Canceling a Run for detailed steps. |
| 3 | Tool Bar | Provides access to the following tabs: - Run Summary: Displays the execution steps and logs for the run. - Lineage: Displays the lineage graph for the run. - Artifacts: Displays the dbt artifacts generated during the run. |
Run Summary Tab
The Run Summary tab is selected by default when you open a run in its detailed view. It shows the sequence of steps executed as part of the run. Each step represents a specific operation performed by Hevo or dbt during the run. For example, in the image above, the following steps are executed in sequence:
-
Clone Git repository: Hevo connects to the linked GitHub repository and pulls the latest version of your dbt project code from the branch configured in the selected environment. This step runs at the start of every execution to make sure the run always uses the most recent version of your code.
-
Create profile for Destination: Hevo generates the dbt connection profile required to connect to the selected Destination. This profile tells dbt where to write the output tables during the run.
-
Invoke dbt deps: Hevo runs the dbt deps command, which installs all the packages listed in your dbt project’s
packages.ymlfile. This step runs before any dbt model commands to make sure all dependencies are available.
Each step shows its name and a status icon indicating whether it completed successfully, is still in progress, or failed. Click a step to expand it and view the full execution log. The log output shows the exact commands run, timestamps, warnings, and errors, making it straightforward to identify exactly where a run failed and what caused it.
Use Search Logs within an expanded step to search for specific keywords in the log output. For example, search for terms such as error or warning to quickly locate potential issues. Click the Download Logs icon next to a step to download its logs for further analysis or sharing with your team.
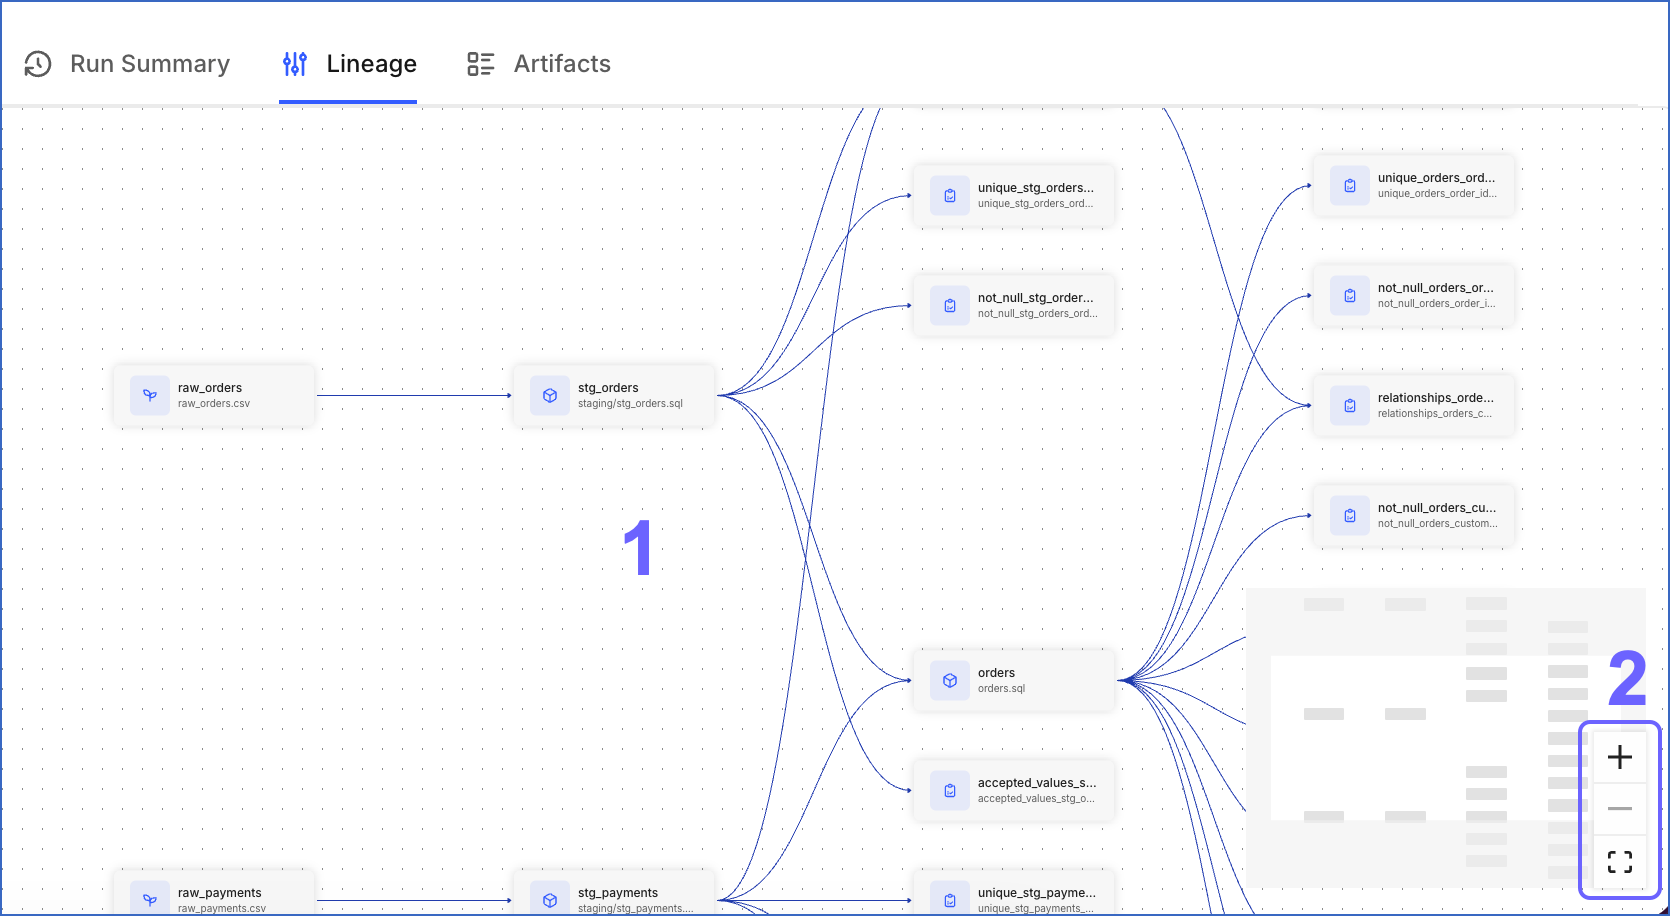
Lineage Tab
The Lineage tab displays a visual map of the dbt model dependencies for the run. The following image highlights the main components displayed and the actions you can perform in this tab:
The following table describes each of these components:
| Page Component | Title | Description |
|---|---|---|
| 1 | Lineage Graph | Displays a visual map of the dbt model dependencies for the run, showing how data flows from source tables through intermediate models to the final output tables in your Destination. The lineage graph helps you trace the impact of a change or failure. If a model fails, you can identify which downstream models are affected. Read Lineage Graph in the dbt documentation to learn more. |
| 2 | Zoom Controls | Use the + and − icons to zoom in or out of the lineage graph. Click the expand icon to view the graph in full screen. |
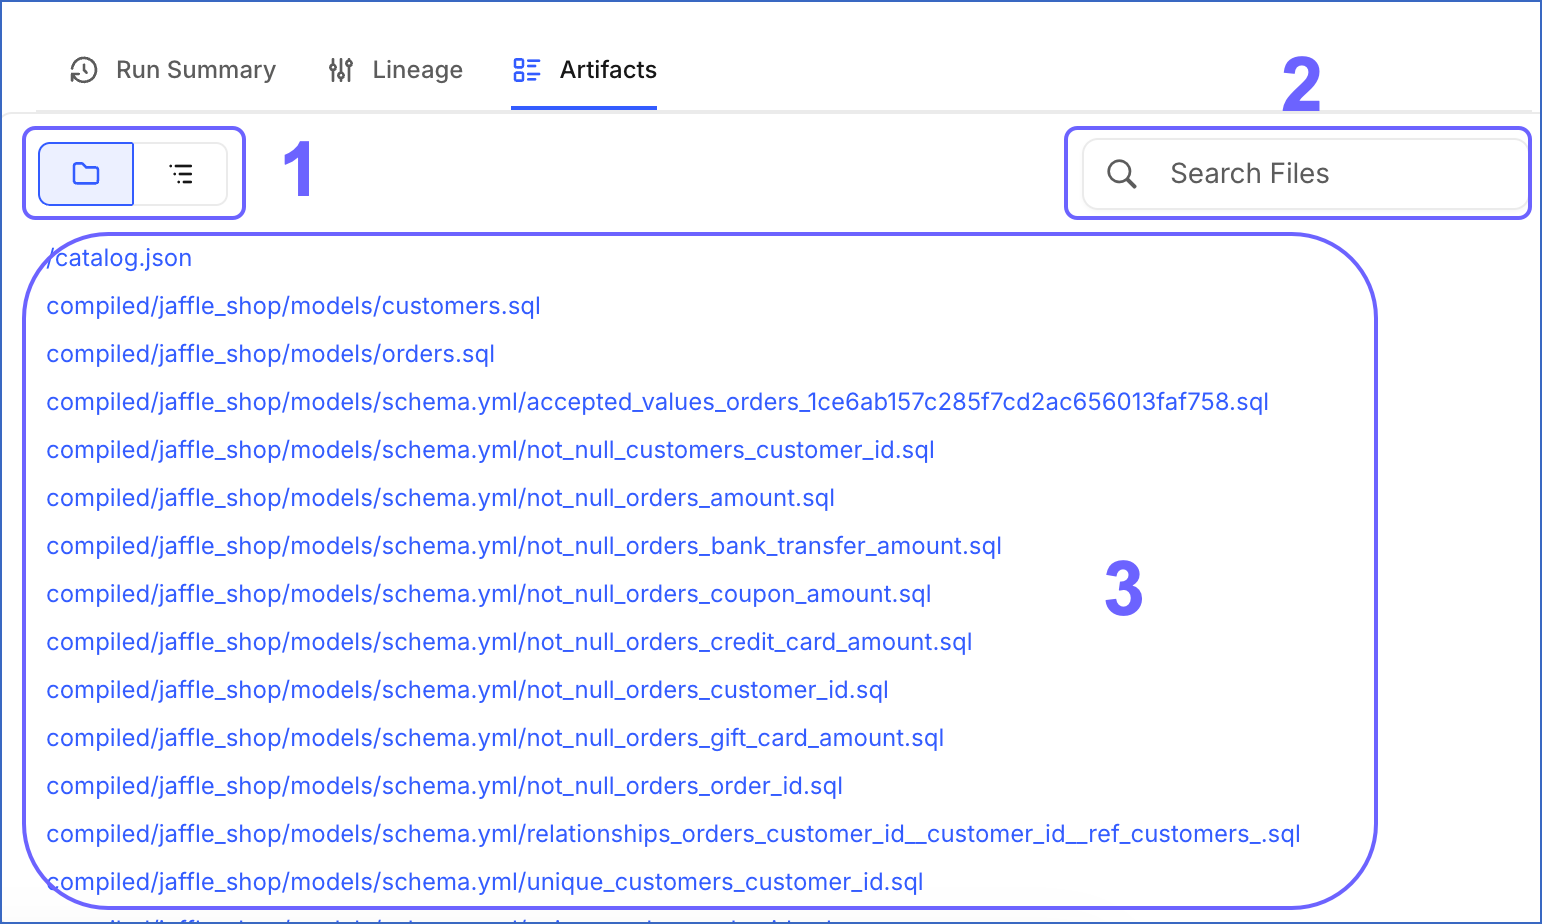
Artifacts Tab
The Artifacts tab displays the output files generated by dbt during the run. The following image highlights the main components displayed and the actions you can perform in this tab:
The following table describes each of these components:
| Page Component | Title | Description |
|---|---|---|
| 1 | View Toggle | Switch between two views of the artifact files: - Flat list view: Displays all files in a single list with their full file paths. - Tree view: Displays files organized in a folder hierarchy that mirrors the directory structure of your dbt project. |
| 2 | Search Files | Search for a specific artifact file using the partial or complete file name. |
| 3 | File List | Click a file to view its contents. These files are useful for debugging. For example, compiled SQL files show exactly what SQL dbt executed against your Destination. Read dbt artifacts in the dbt documentation to learn more. |
Triggering a Re-run
You can re-run a completed or failed run to trigger a new execution of the same job. The new run uses the latest commit from the branch connected to the selected environment. If the code has changed since the original run, the re-run may produce different results.
Perform the following steps to trigger a re-run:
-
In the Navigation Bar, click Transformations.
-
On the Transformations page, select the project whose job run you want to re-run.
-
In the Run History tab, click the run you want to re-run to open it in the detailed view.
-
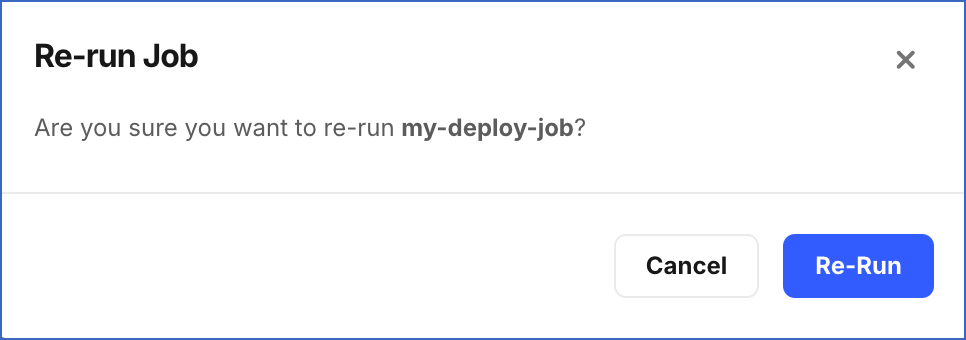
On the slide-in page, click Re-run.
-
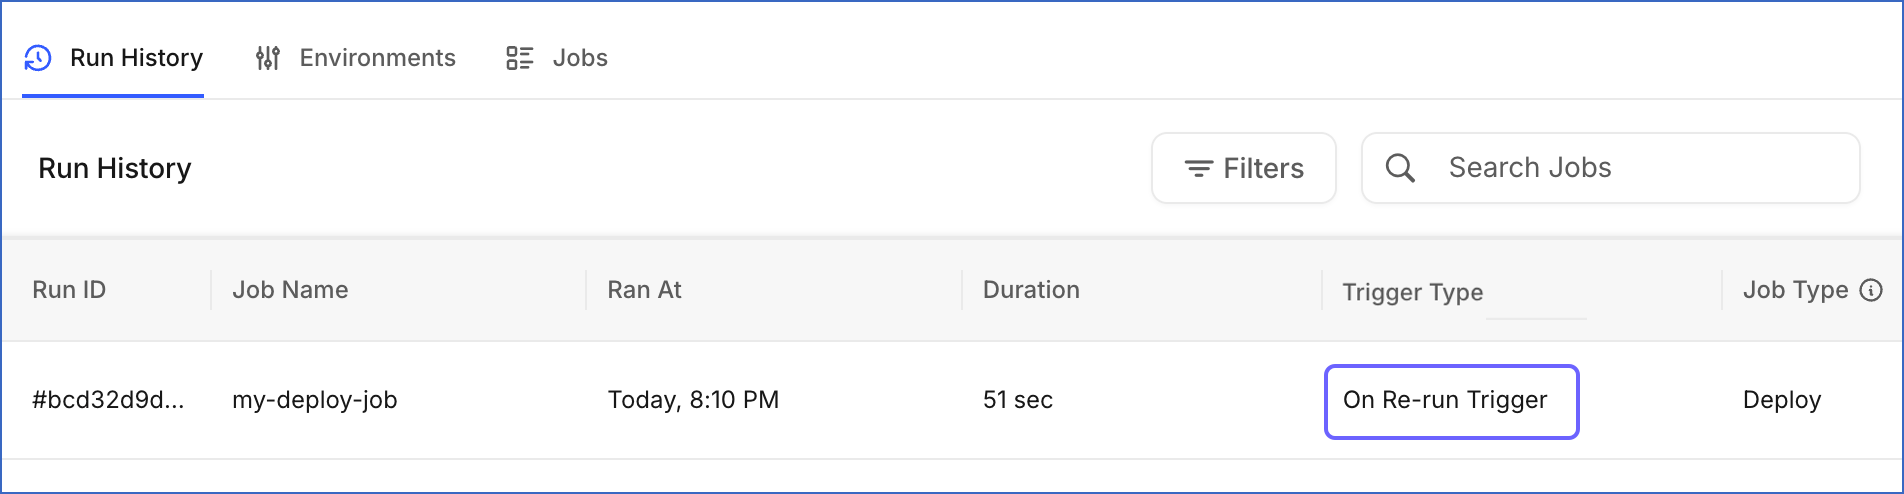
In the Re-run Job dialog, click Re-Run.
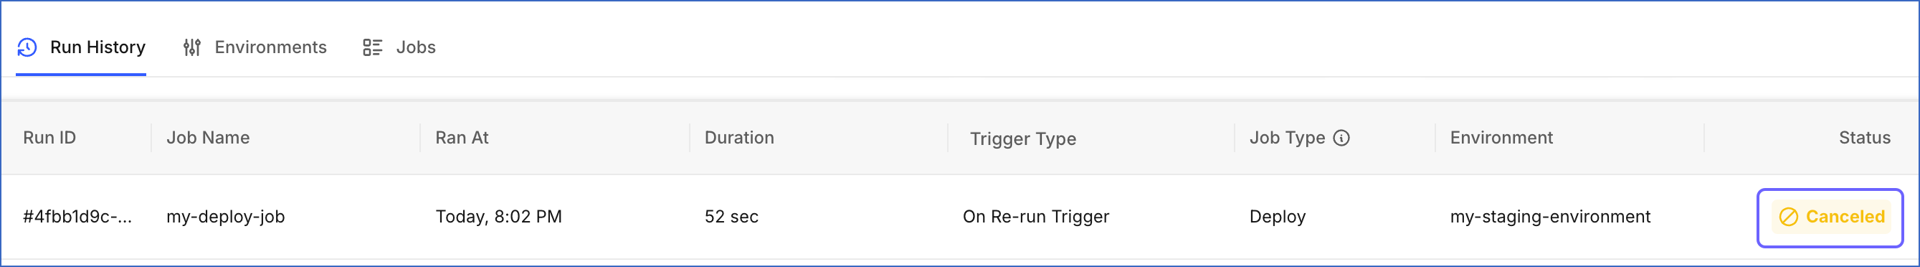
A new run is created and appears in the Run History tab with the trigger type On Re-run Trigger.
Canceling a Run
You can cancel a run that is currently in progress. Canceling a run stops all execution immediately. If a run is canceled mid-execution, your Destination data may be in a partially updated state until the next successful run of the same job.
Perform the following steps to cancel a run:
-
In the Navigation Bar, click Transformations.
-
On the Transformations page, select the project whose job run you want to cancel.
-
In the Run History tab, click the run you want to cancel to open it in the detailed view.
-
On the slide-in page, click Cancel Run.
-
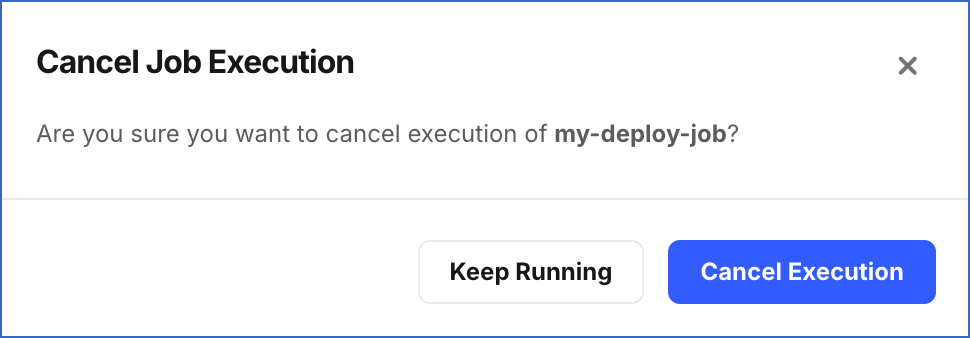
In the Cancel Job Execution dialog, click Cancel Execution.
The run status changes to Canceled.