Viewing Pipeline Job Details (Edge)
Hevo Edge Pipeline creates various jobs to sync data from the Source with the Destination, either on schedule or on demand. These jobs and the replication details of each object included in them can be viewed from the Job History tab in the Pipelines Detailed View.
Accessing the Jobs List
-
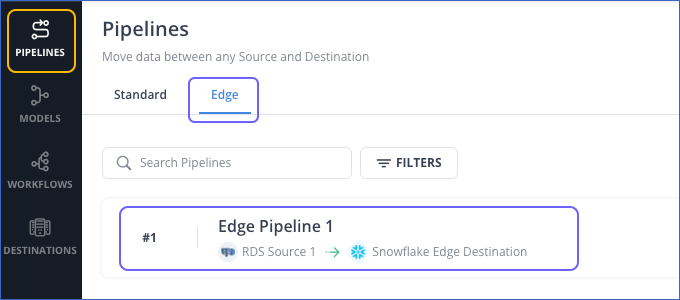
Log in to your Hevo account. By default, PIPELINES is selected in the Navigation Bar.
-
In the Pipelines List View, click the Edge tab and then click your Pipeline to view the list of jobs created for it.
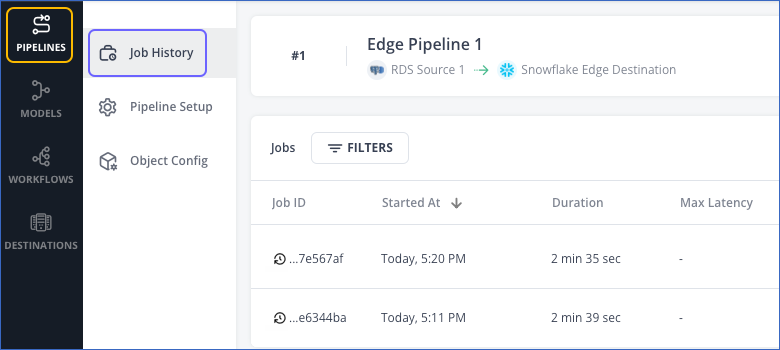
You can also access the Jobs list by clicking Job History on the Tool Bar of your Pipeline.
Viewing the Job Run Details
The jobs created for a Pipeline are listed in its detailed view. The jobs list displays the following details:

Refer to the table below for a description of the Jobs List View:
| Column Name | Description |
|---|---|
| Job ID | The unique alphanumeric ID auto-assigned to the job on its creation. |
| Started At | The time at which the job started. |
| Duration | The time for which the job ran. |
| Max Latency | The maximum of the latencies across all Source objects processed by the job. |
| # Ingested | The total number of Source Events ingested for the objects included in the job. This count of ingested Events equals the sum of loaded and failed Events in a job. |
| # Loaded | The number of Events loaded to the Destination for the objects included in the job. In case there are failures, this count may not match the count of ingested Events. |
| # Failed | The number of Events that were not loaded to the Destination. For example, if the Destination does not support the incoming Source data type or decimal precision, the Events are not loaded. |
| Status | The status of the job, for example, In Progress or Completed. Refer to the Job and Object Statuses table for details. |
View the Job run and Object summary
Access the Jobs List. In the list, click a job to view its information. The sections below provide the details of the job run and the objects it processed.
-
Job run summary
In the job’s summary section, you can view:

-
The job details such as the type, ID, and status. You can copy the job ID by clicking the copy (
 ) icon.
 -
The job run details such as:
-
The start time of the job, the duration for which it ran, and its maximum latency.
-
The number of objects processed, queued, and failed.
-
The count of ingested, loaded, and failed Events.
-
The count of Billable and Non-billable Events.
Note: All Events loaded to your Destination during public review are free.
-
-
The REFRESH and Download Session Log actions.
-
-
Objects summary
In the Objects summary section, you can view:
-
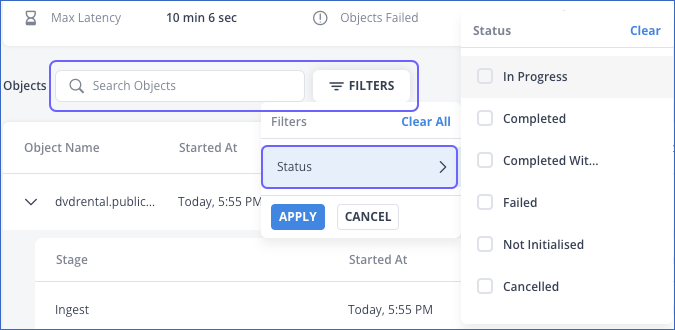
The Search bar and the FILTERS action. You can filter the objects by selecting from one or more of the displayed statuses:
-
The object details such as:

-
The object name.
-
The start time indicates when the job started ingesting data from the object.
-
The total time taken by the job to ingest data from the object and load it to the Destination.
-
The maximum latency for the object.
-
The object’s offset. The offset is updated once ingestion is completed.
-
The count of ingested, loaded, and failed Events
-
The object’s status.
-
-
View the Object replication details
To view the ingestion and loading details for an object:
-
Click a job to view its details.
-
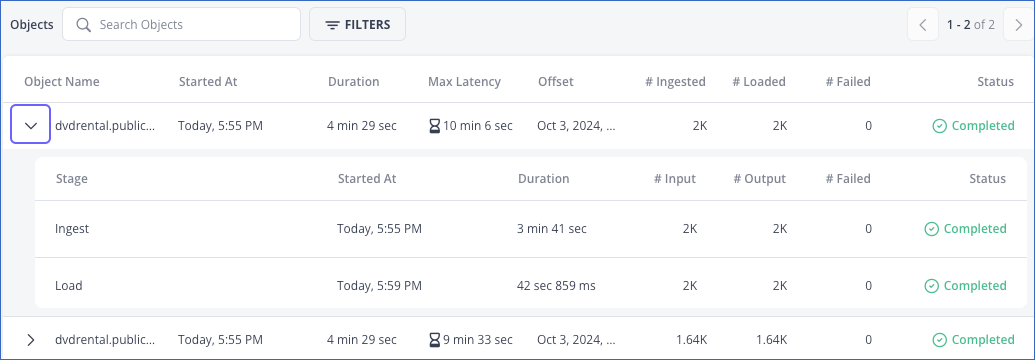
In the Objects section, click the drop-down next to an object to view:
-
The status of the ingestion and loading stage.
-
The details of each stage such as:
-
The start time and duration for which the task ran.
-
The number of Events read from the object (# Input), successfully processed (# Output), and the count of failed Events (# Failed), if any.
-
-
Filtering the Jobs List
You can control the data displayed for your Pipeline by filtering the list of jobs created. Filtering the jobs list helps you gain insights, such as the number and type of jobs that ran in your Pipeline on a particular day.
You can filter the jobs based on the following categories:
-
Status: The status of the job at the end of its run. You can select from one or more of the following statuses:

-
In Progress: The job has been initialized and is currently running.
-
Completed: The job ran successfully, and all the ingested data was loaded into the Destination.
-
Completed with Failures: The job run has ended, but not all records were processed successfully.
-
Canceled: The job was canceled.
-
Canceling: The job is being canceled.
-
Failed: The job did not run successfully.
-
Skipped: The job was skipped as another job is currently in progress.
-
-
Job Type: The kind of job that was run. You can select from one or more of the following job types:

-
Incremental: This job ingests only new or modified data from the Source and loads it to the Destination.
-
Historical: This job ingests all data existing in the Source at the time of Pipeline creation and loads it to the Destination.
-
Resync: This job re-ingests historical data for all active objects in the Pipeline and updates the Destination tables if changes are detected in the re-ingested data.
-
Resync with drop and load: This job drops and recreates the Destination tables for all active objects in the Pipeline. It then re-ingests all data from the Source objects and loads it into the newly created Destination tables.
-
-
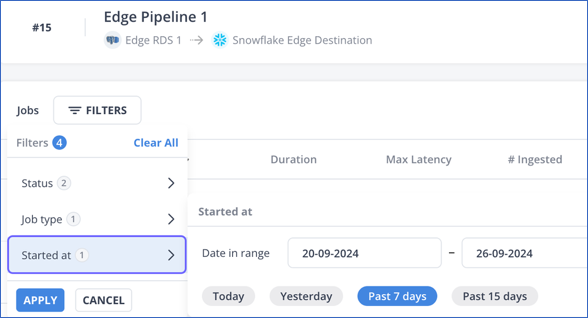
Started at: The date and time when the job was started. You can filter data using this criterion by:
-
Specifying a date range. In the Date in range field, provide the start date, the end date, or both in the DD-MM-YYYY format. In case only one of the date parameters is given, Hevo behaves in the following manner:
-
If only the start date is provided, the end date is taken as the current date. For example, if the start date is 20-09-2024 and today is September 29, 2024, the end date becomes 29-09-2024.
-
If only the end date is provided, the start date is taken to be a year before the end date. For example, if the end date is 29-09-2024, the start date is taken as 29-09-2023.
-
-
Selecting from one of the suggested date criteria. The Date in range field is automatically populated with the dates for the specified value.
-
You can include multiple categories in your filter. For example, you can create a filter to view the number of incremental jobs that were completed today.
To filter your jobs list:
-
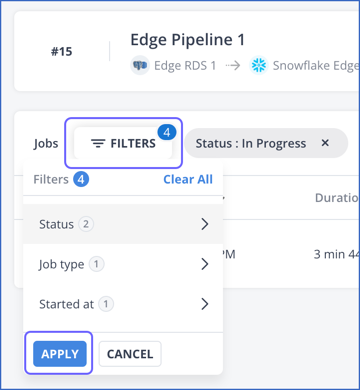
In the Pipelines Detailed View, click FILTERS and select your filter criteria.
-
Click APPLY.
The number of filters and their names are displayed at the top of the filtered Jobs view.

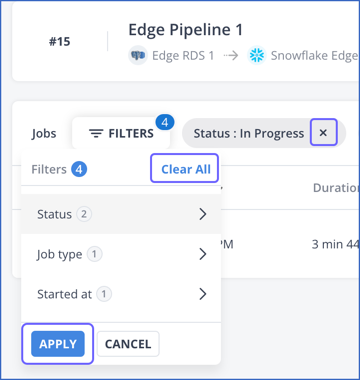
You can clear each filter individually or clear all of them at once. For this:
-
Do one of the following:
-
Click the (
 ) icon next to the filter that you want to clear.
 -
In the FILTERS drop-down, click Clear All.
-
-
Click APPLY.
Sorting the Jobs List
You can organize the list of jobs created for your Pipeline by sorting them based on these columns:

-
Started At: The date and time when the job was started. By default, Hevo sorts the jobs list in descending order based on the start time, indicated by the down arrow (
 ) icon next to the name.
 -
# Ingested: The total number of Events ingested from all the Source objects included in the job.
-
# Loaded: The number of Events successfully loaded into the Destination across all objects included in the job.
-
# Failed: The number of Events that were not loaded into the Destination by the job.
You can identify the sorting columns by hovering over their names. Hevo displays an up/down arrow ( ![]() ) icon before the name. A down arrow is displayed next to the column by which the list is currently sorted.
) icon before the name. A down arrow is displayed next to the column by which the list is currently sorted.
To sort the list of jobs by any one of the columns mentioned above, do the following:
-
In the Jobs list, hover over the column by which you want to sort the list and click the up/down arrow (
 ) icon next to its name.
An arrow indicating the order by which the list is sorted is displayed next to the column name.

Note: Clicking the down arrow (![]() ) icon resets the sort order. You can then sort the jobs list in ascending order.
) icon resets the sort order. You can then sort the jobs list in ascending order.